Data Analysis in Functional Near Infrared Spectroscopy
Schroeter M.L.1, Kruggel F.2
1 Max-Planck-Institute of Cognitive Neuroscience, Leipzig, 2 University of California, Irvine
Functional near-infrared spectroscopy (fNIRS) allows functional imaging of brain activation by measuring changes in the concentration of oxy- and deoxy-haemoglobin (Hb) as well as the changes in the redox state of cytochrome-c-oxidase (Cyt-Ox) by their different specific spectra in the near-infrared range between 700-1000 nm. To examine the feasibility of fNIRS for the event-related approach in studies with cognitive paradigms, brain activation was measured by fNIRS while performing a colour-word matching Stroop task in an event-related design. Optodes were placed over the lateral prefrontal cortex (F7/8, F3/4, FC3/4), the intraparietal sulcus (P3/4), primary visual (O1/2) and primary motor cortices (C3/4).
|
|
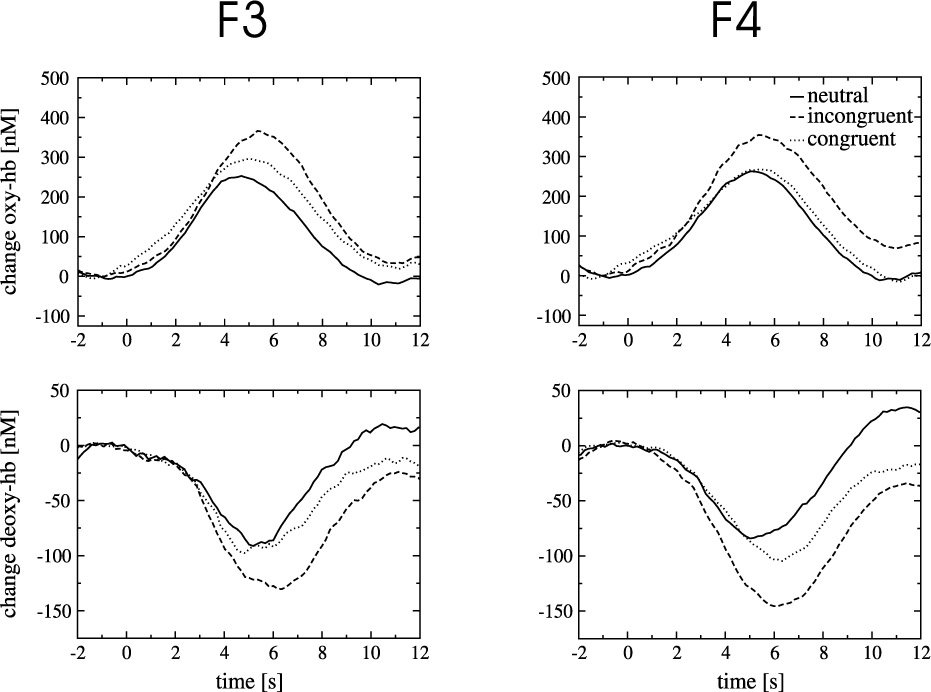
Top: Optode positions according to the international 10/20 system in relation to the corresponding cortical areas as revealed by an MR dataset of a test subject. Above: Time courses for concentrations of oxy- and deoxy-haemoglobin (Hb) during a colour-word matching Stroop task at the position F3/4. Average across 14 subjects.
During the task, concentrations of oxy-Hb increased and deoxy-Hb decreased due to an increased cerebral blood flow. Signal changes were significantly stronger during the incongruent than the neutral condition at positions F3/4, F7/8 and FC3/4 over the lateral prefrontal cortex. Thus, incongruent trials led to a stronger brain activation and, hence, vascular response compared with neutral trials due to interference reduction [Schroeter et al., 2002].
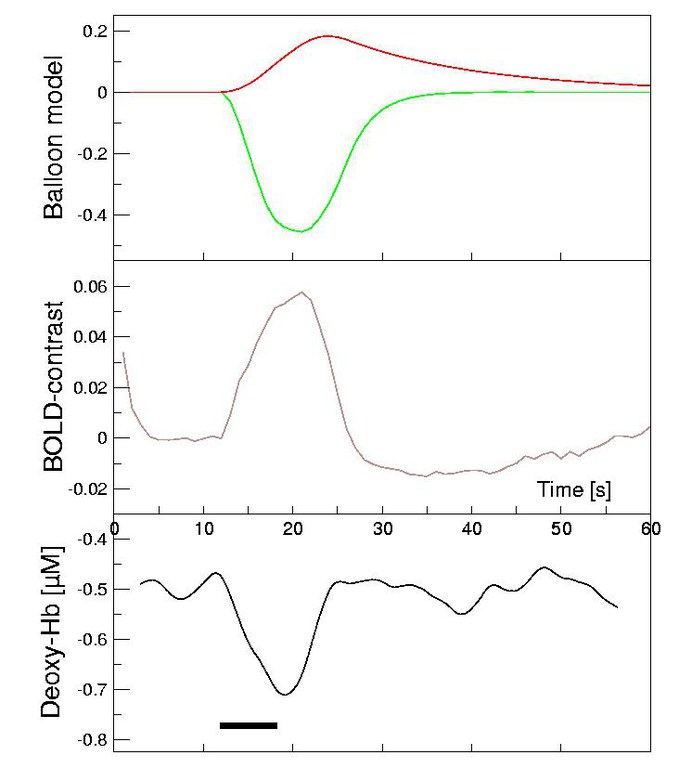
To evaluate the correspondence of the hemodynamic response measured by fNIRS and fMRI, brain activation was measured simultaneously during visual stimulation with an array of rotating red L-shapes. Optodes were placed at position O1 (over the left visual cortex). For fMRI measurements, ten coronal slices of 5 mm thickness were recorded with an EPI protocol. During visual stimulation, the concentration of deoxy-Hb (fNIRS) decreased, whereas the BOLD signal increased in the visual cortex. The concentration change of deoxy-Hb as measured by fNIRS corresponded to the concentration change of deoxy-Hb as calculated from the BOLD signal according to the Balloon model. Both signals correlated best in a depth of 7-21 mm, in good agreement with a IR depth penetration of 2 cm at a detector/sensor spacing of 4 cm. Brain activation as measured by fNIRS is in accordance with fMRI.
|
|
Time courses for deoxy-haemoglobin (green) and cerebral blood volume (red) as calculated by the Balloon model from the BOLD signal (brown). In black, concentration change of deoxy-Hb as measured by fNIRS. The black bar corresponds to the time window of the visual stimulus.
Read more...
Schroeter M.L., Zysset S., Kruggel F., von Cramon D.Y. (2003) Age-dependency of the Hemodynamic Response as Measured by Functional Near-Infrared Spectroscopy. Neuroimage 19, 555-564.
Schroeter M.L., Zysset S., Kupka T., Kruggel F., von Cramon D.Y. (2002) Near-infrared spectroscopy can detect brain activity during a color-word matching Stroop task in an event-related design. Human Brain Mapping 17, 61-71.


